

.jpg)

Alpine Capital Investor Newsletter - Q2 2026
Share article


1. Market Overview
After spending Q1 explaining why the S&P 500's –4.8% print understated the strength of the underlying economy, we find ourselves this quarter on precisely the opposite problem: the S&P 500 rose 15.2% in Q2, but the headline number tells you remarkably little about the quarter that produced it. On the face of it the print speaks for itself — the index's biggest quarterly gain since the post-pandemic recovery in mid-2020, with roughly two-thirds of the 500 constituents finishing higher.

The rally's drivers were largely familiar. AI and technology names extended their leadership. Earnings continued to come in ahead of what analysts had budgeted, with Q2 earnings-growth expectations for the S&P 500 revised higher through the quarter. And, encouragingly, the mega-caps did not carry the rally alone this time. Small-caps and micro-caps printed fresh highs, as did equal-weighted and value benchmarks — a broader participation profile than we have seen for most of the past two years. That kind of broadening is what a healthy expansion is meant to look like.
But that is where the clean narrative breaks down. Underneath the index, the market behaved nothing like the headline suggested. The VIX — a gauge of index-level risk — eased steadily lower across the quarter, projecting an image of calm. Look at individual stocks, though, and a very different picture emerges. Single-stock volatility climbed to a 12-month high, averaging 45% by quarter-end. The internals of the S&P 500 make this divergence even harder to ignore. Of the 500 constituents, 170 ended the quarter in the red, losing roughly 11% on average. Within that group, 81 names fell more than 10%, averaging a decline closer to 19% — a genuinely painful quarter for a sizeable part of the index, one the 15.2% headline number conceals rather than reflects.
This dispersion — which we have written about in various forms over recent quarters — is the defining feature of the current cycle for an active capital allocator. It creates a constant stream of both opportunities and traps, and it forces us to weigh potential returns against tax consequences (where applicable) on almost every position change.
2. The Q2 Rotation: From Silicon Froth to Hyperscaler Value
If Q1 was the SaaSpocalypse quarter, Q2 was the great rotation quarter — a reallocation of capital between the two main beneficiaries of the AI buildout: the semiconductor complex on the one hand, and the hyperscalers on the other. The semiconductor and broader AI supply chain complex ran hard for most of the quarter, while the hyperscalers — the big-spending customers on the other side of that trade — endured a genuine bloodbath in June. Oracle recorded its worst month since September 1990. Microsoft, Alphabet, Meta Platforms and Amazon were all sold aggressively as the return-on-investment question grew louder.
The tension we have been fighting
Before we get into what we did, we want to provide some context on the current environment. One of the main challenges in Q2 — and the one we are consistently faced with — is the tension between long-term investing discipline and short-term opportunism. The AI buildout era is not moving straight up and to the right; it is moving via extreme dispersion, with some stocks up 50% and others down 50% while the S&P 500 sits close to all-time highs. That dispersion means that missing a single opportunity, or holding a single position too long, can meaningfully impact returns on both an absolute and a relative basis. We are forced to consider every opportunity, because that is the nature of the environment. Layered on top of that is tax: in a taxable portfolio, every decision to sell a winner carries a real cost, and that cost must be weighed against the marginal return available from redeploying the capital elsewhere. This is a genuine tussle, and we do not pretend it is a solved problem. It is the trade-off we live with, and one we try to manage as thoughtfully as we can — with a bias, on balance, towards capital preservation and long-term compounding rather than trading.
The hyperscaler ROI narrative
The hyperscalers continue to invest in infrastructure — a point we have raised in previous newsletters. Combined capex from the major hyperscalers reached approximately $416 billion in 2025 and is projected to exceed $750 billion in 2026, approaching $1 trillion by 2028. The semiconductor complex has been the primary beneficiary of that spend, which is reflected in the run-up of semiconductor share prices. The hyperscalers, meanwhile, have been punished for the very spending that is enriching their suppliers, the “picks and shovels”. The narrative pushing the sell-off is straightforward: if returns do eventually come, the question is whether they'll exceed the cost of capital, and when. Our view is just as straightforward: at worst, the money is being spent to solidify their positions and defend their moats at the expense of short-term cash flows. At best, it is laying the foundation for the next decade of above market earnings.
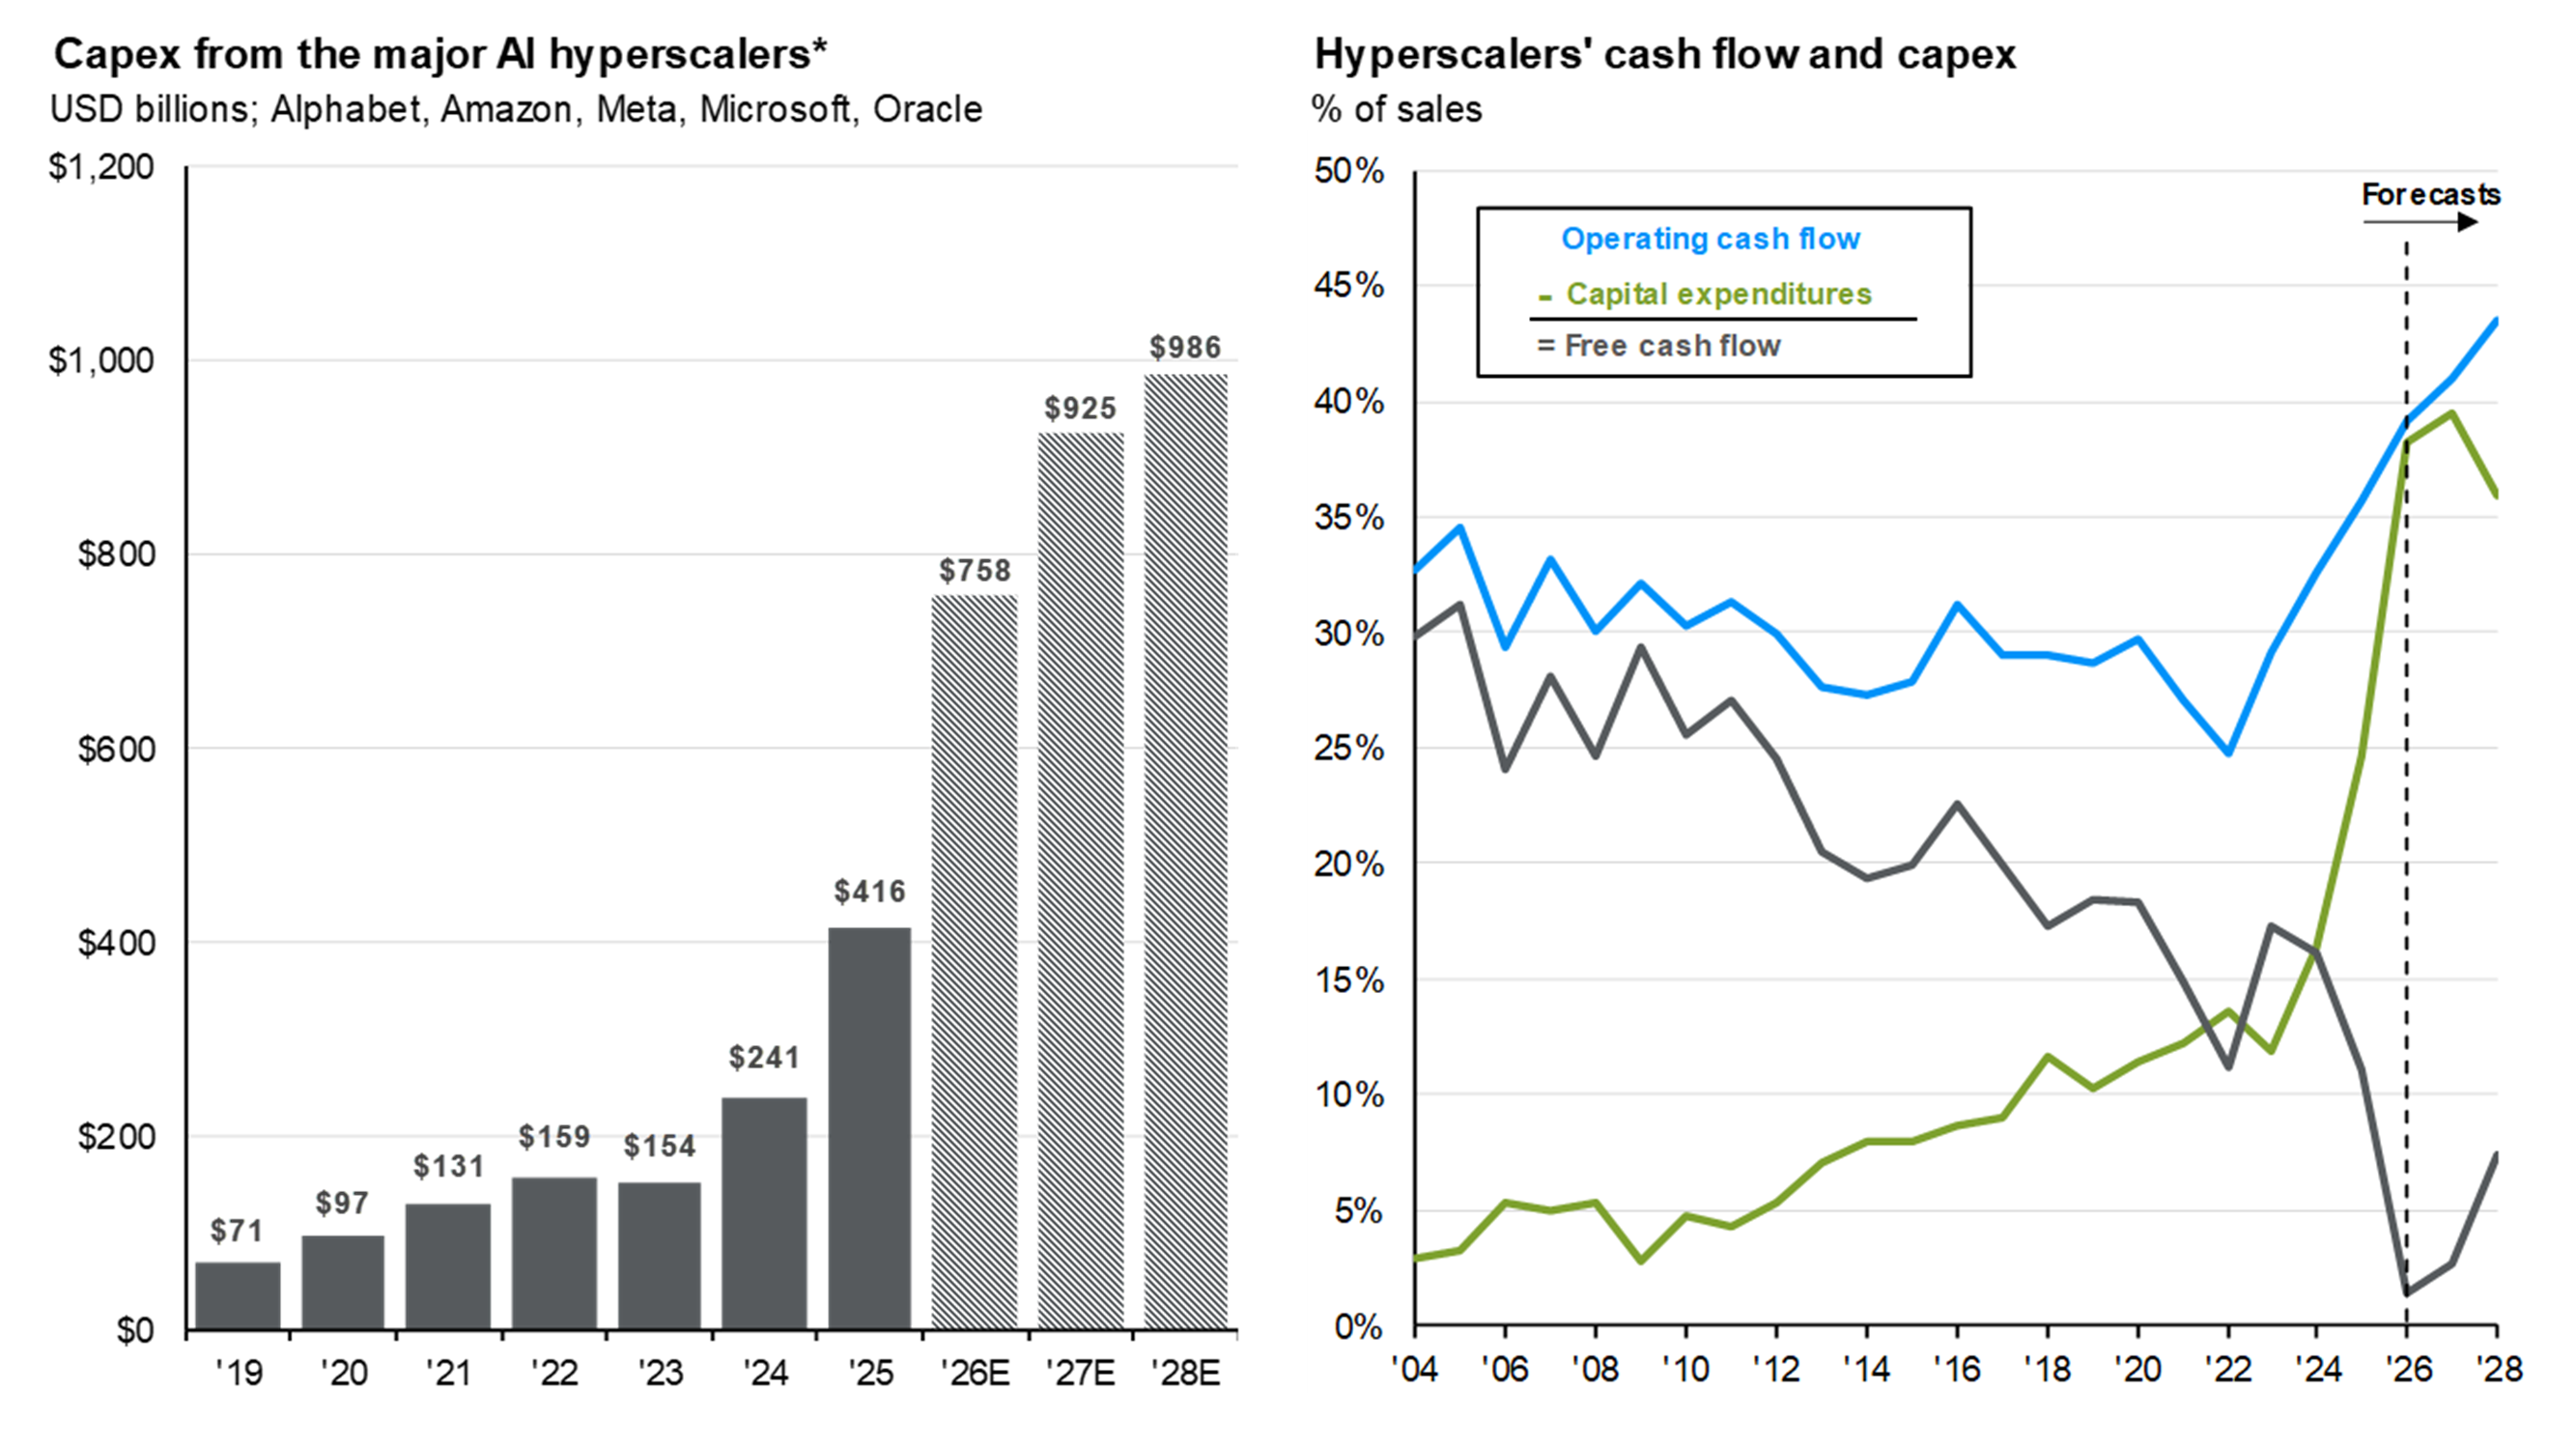
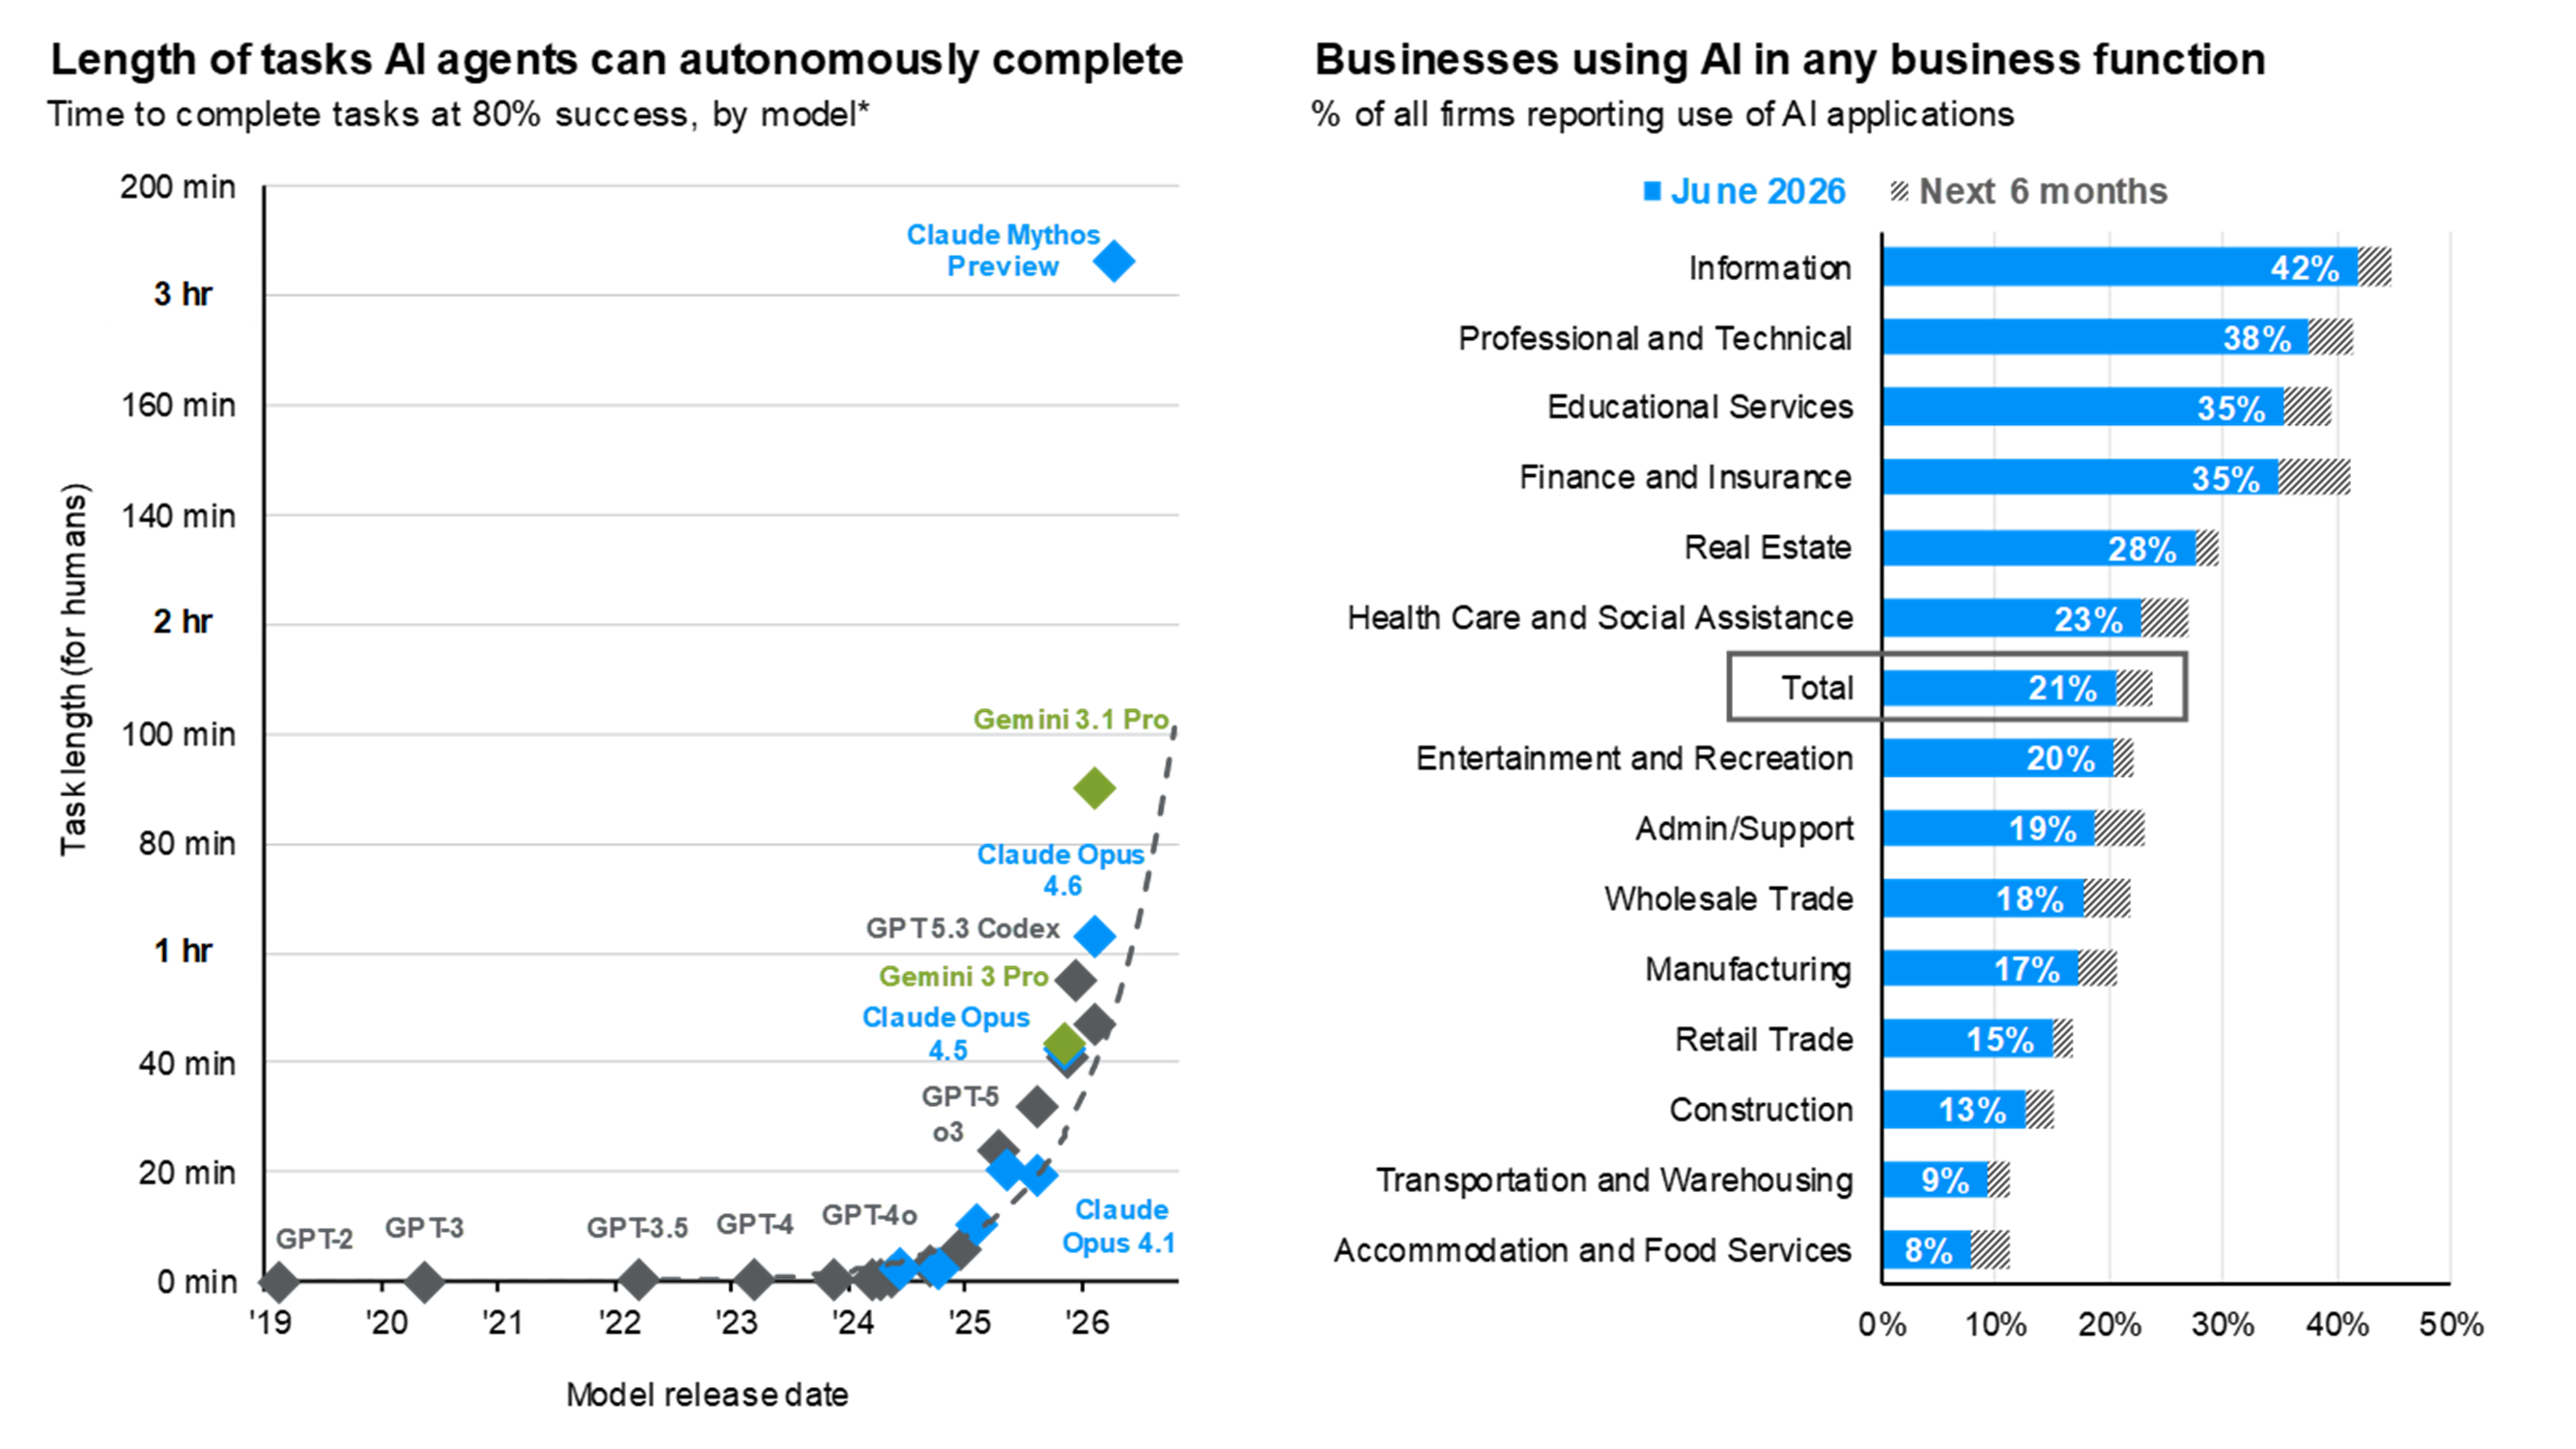
Let us assume, for a moment, that AI as a whole is a bubble — which we have repeatedly said it is not. Even under that scenario, the current position of Microsoft, Meta, Alphabet and Amazon reminds us of Meta in 2022. Investors panicked as Meta poured money into projects with no clear return; the share price cratered. Once Zuckerberg "admitted defeat" under extreme shareholder pressure and reversed course, the share price recovered quickly. The underlying issue for the hyperscalers today is similar: they built their reputations as asset-light businesses, and the AI buildout is forcing them to become considerably less asset-light. Somewhere between the initial buildout and the return on that investment finding equilibrium, these companies will regain clarity on future cash flows and earnings projections, and the market will reprice them accordingly. The chart below on AI capability and adoption reinforces why we believe the spending is defensible: AI is getting more efficient and more powerful at a rapid pace, real-world adoption is accelerating, and the return on that spending should follow.
The frontier lab question
The other conversation dominating the investment landscape is the fight between the closed frontier labs (OpenAI, Anthropic, and the rest) versus (1) open-source models and (2) other cheaper closed models. The current beneficiaries are the frontier labs, with Anthropic and OpenAI dominating dollar revenue from token spend — the others are far behind. Our view is that a more realistic and safer world is one in which the dollar-revenue split of token spend diversifies significantly between the various labs, whether open source or closed. This is inevitable, in our view. The onslaught on the frontier labs' estimated 90%+ inference margins is on its way. For AI to have the impact it is genuinely capable of — on the end user, the average consumer — this must happen. Otherwise, AI is structurally broken. A diverse AI market is a prerequisite for applications being built, for value being added down the stack, and for the political and sovereign-safety concerns that come with a small number of labs capturing the majority of the value to be addressed. That does not mean the frontier labs' revenue should necessarily decrease — it means the total pie will probably grow and everyone will participate. It may take time, but the direction of travel is clear.
Portfolio actions in Q2
We remain structurally positive on semiconductors and their utility-like position in the AI stack over the long term. But as capital allocators, our role is to consider all options at all times and to deploy capital where we see relatively better opportunities for return. In Q2, that meant reducing our semiconductor exposure and adding to our hyperscaler exposure after their pullbacks. We view big tech, following the June sell-off, as attractively priced with reinforced moats and multiple revenue streams — offering good upside potential and relatively small downside risk when measured against the market's overall downside risk.
Oracle initiation. In Q2 we originated positions in Oracle in certain portfolios. Oracle's price action since initiation has been disappointing. We understand the market is pricing in its negative free cash flow and probable future capital raise, but we believe the valuation is attractive and the current view on Larry Ellison (co-founder) is probabilistically asymmetric given the entry point. Oracle can slow spending if AI reverses (which we do not think will happen).
Increased Microsoft to overweight. We increased Microsoft to an overweight position. It is increasingly probable, in our view, that a distinct application layer will emerge between the LLMs and end users — particularly in commercial usage, where IP protection matters, security requirements are heavy, and the security layer of raw LLMs today remains very obscure. Microsoft is uniquely positioned to own or be a central part of that application layer, as they have immense distribution leverage and this reinforces our comfort of holding it as a core position across portfolios, especially given the current valuation.
Valuations — top ten versus the rest
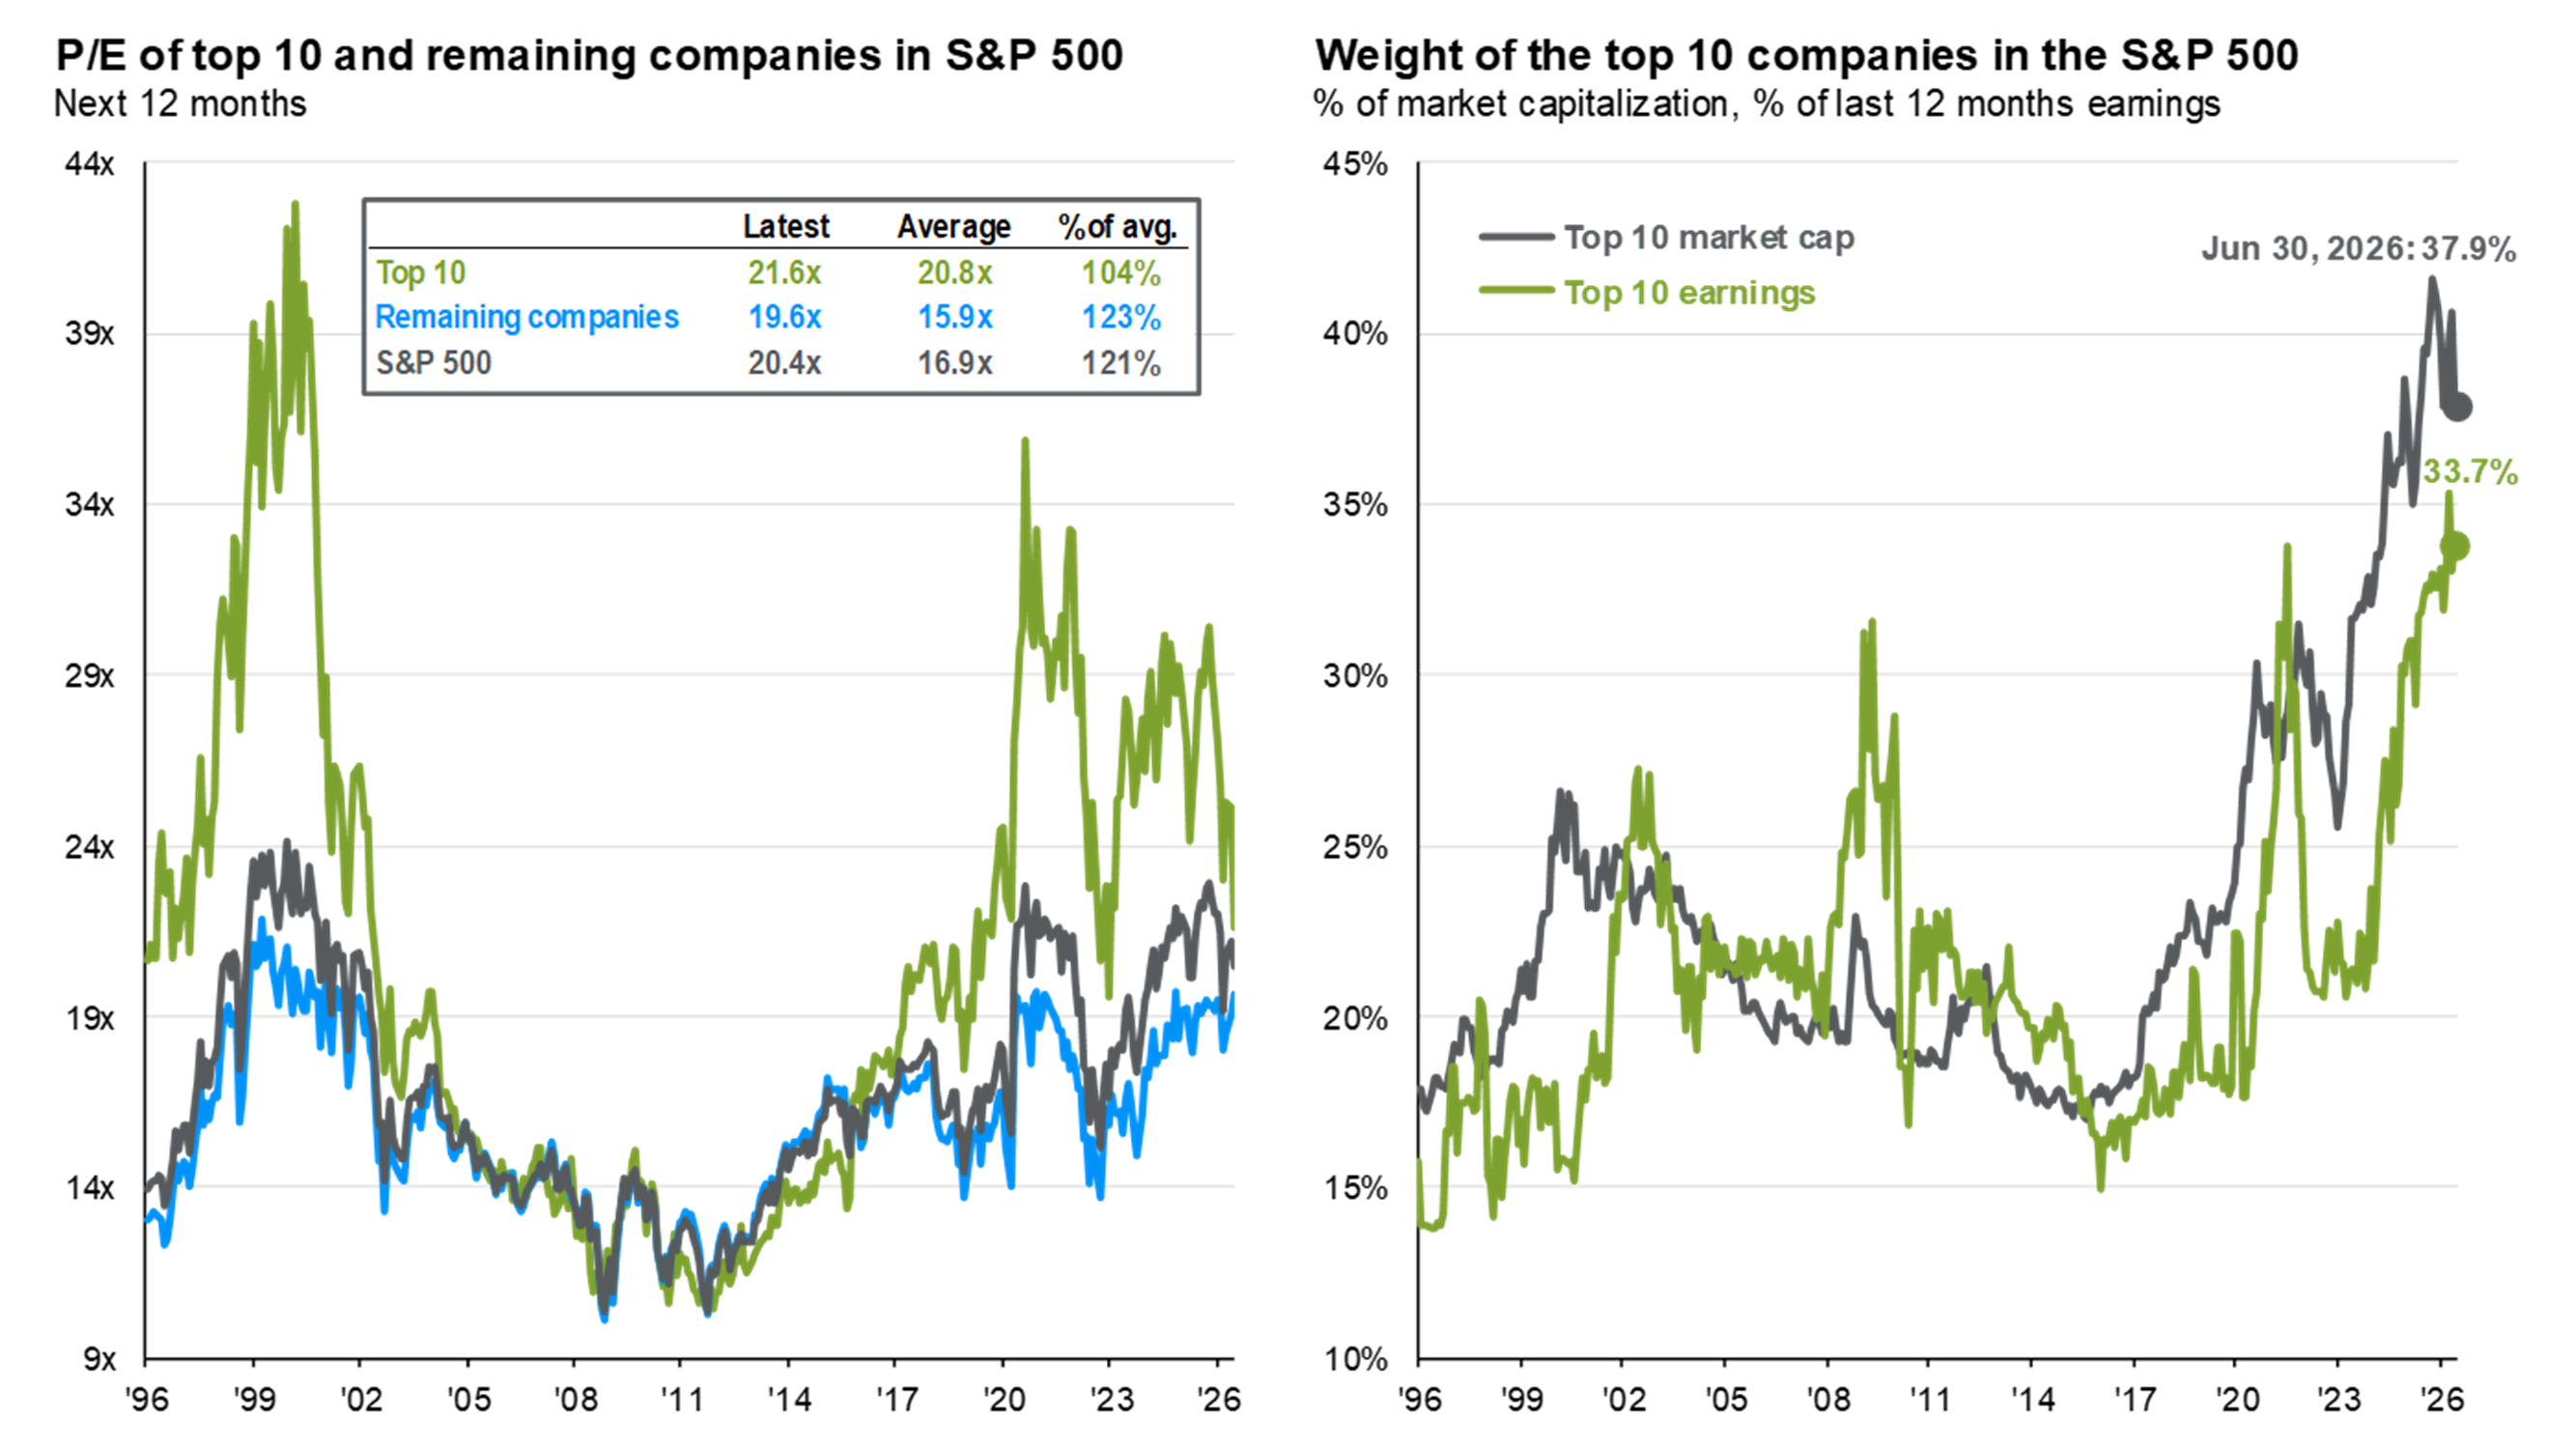
One chart worth spending time with. The top ten companies in the S&P 500 are not as expensive relative to the rest of the index as they were 12–18 months ago. Large tech — which makes up the majority of that top ten cohort — has grown into its valuations. On the latest numbers, the top ten trades at approximately 21.6x forward earnings versus 19.6x for the remaining 490 companies. The premium is unusually narrow by recent standards. This is a helpful reference point for anyone who still assumes the largest companies are stretched — because on a relative basis, they simply aren't anymore. Their weight in the index remains at multi-decade highs, but their earnings weight (33.7%) is now catching up to their market-cap weight (37.9%) — the fundamentals are growing into the price.
3. Macro Crosscurrents
The Warsh transition and the constraint on the Fed
Kevin Warsh has been Fed chair since 22 May, though markets have only seen him in action once: his first FOMC meeting on 17 June. That leaves considerable uncertainty over the near-term policy path. But we would argue the medium-term direction is considerably more constrained than most commentators appreciate.
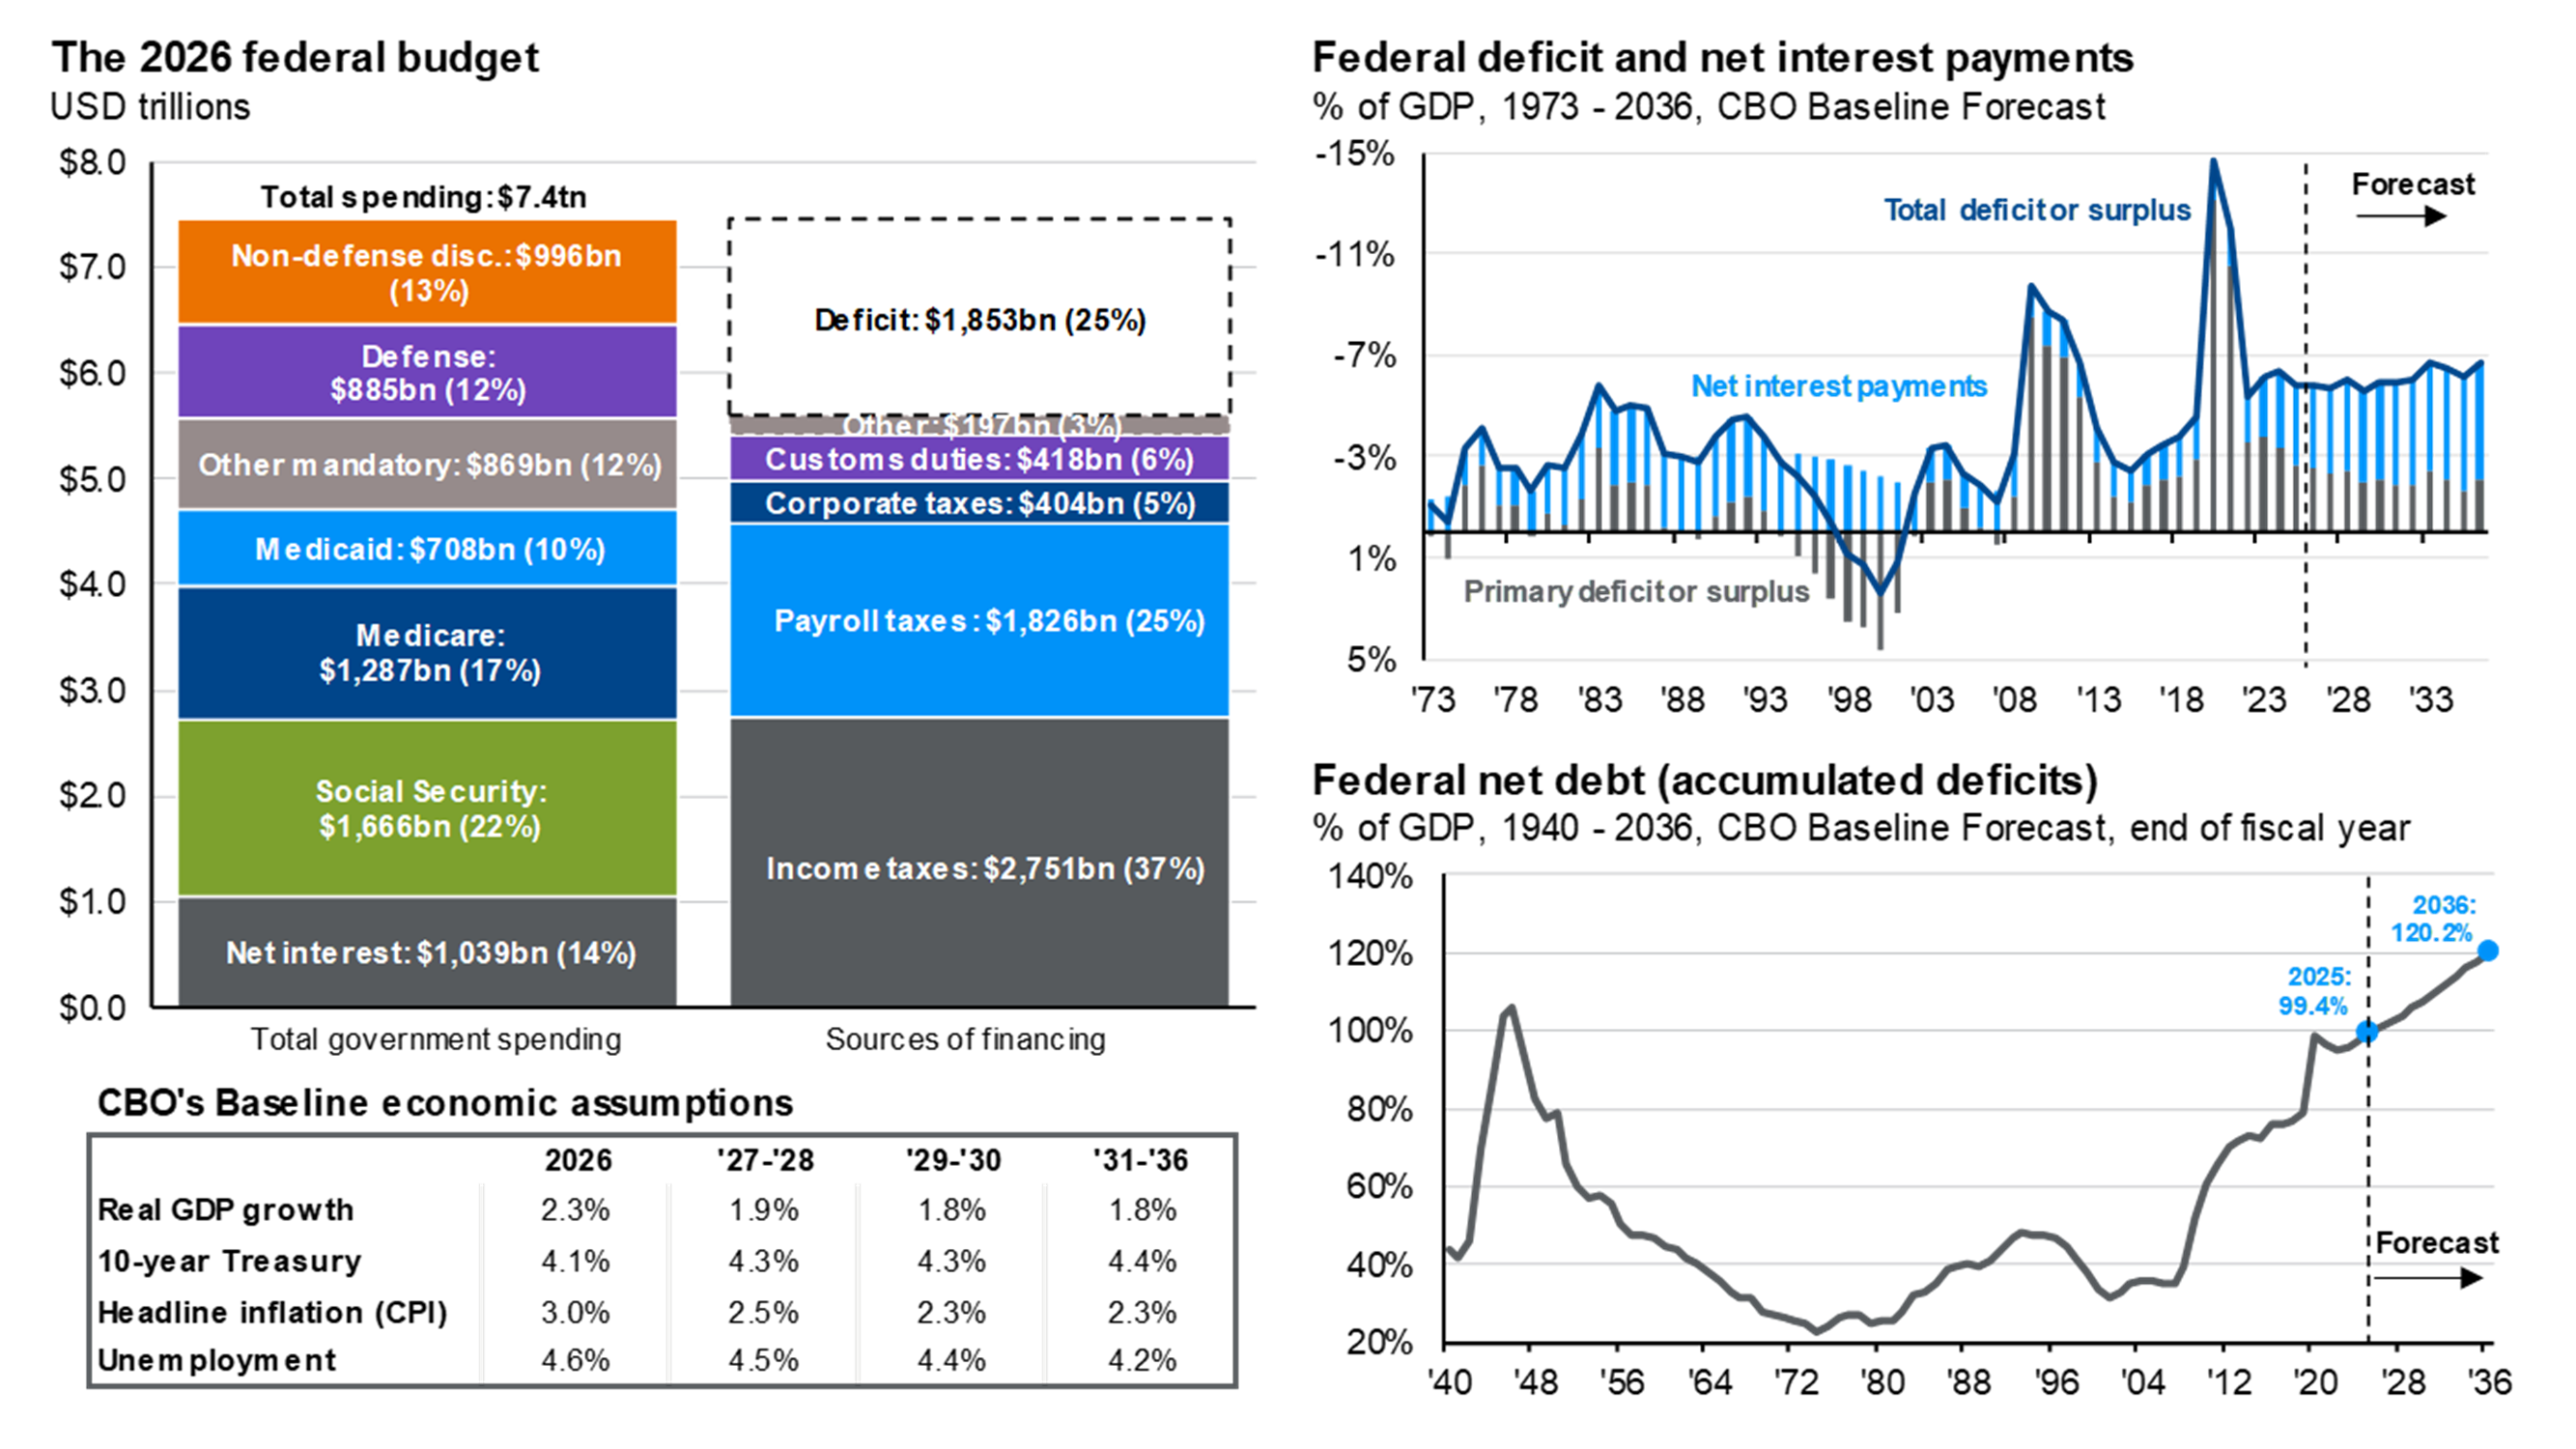
With the federal government expected to run deficits of roughly 7% of GDP for the foreseeable future — a figure that would be extraordinary in almost any other historical context — there is immense structural pressure on the Fed to avoid raising interest rates. Federal net debt is projected to exceed 120% of GDP within the next decade on the CBO's baseline forecast. This is not a normal fiscal environment, and it is not one in which the Fed has the luxury of ignoring the debt burden when adjusting policy. If the interest-rate path were to move sustainably upward, the debt-service cost would compound in a way that becomes economically untenable while the deficit is running at 7%. That cycle cannot happen. The trajectory from here therefore remains, in our view, downward over the medium to longer term — even if the exact path is uncertain over the next few quarters.
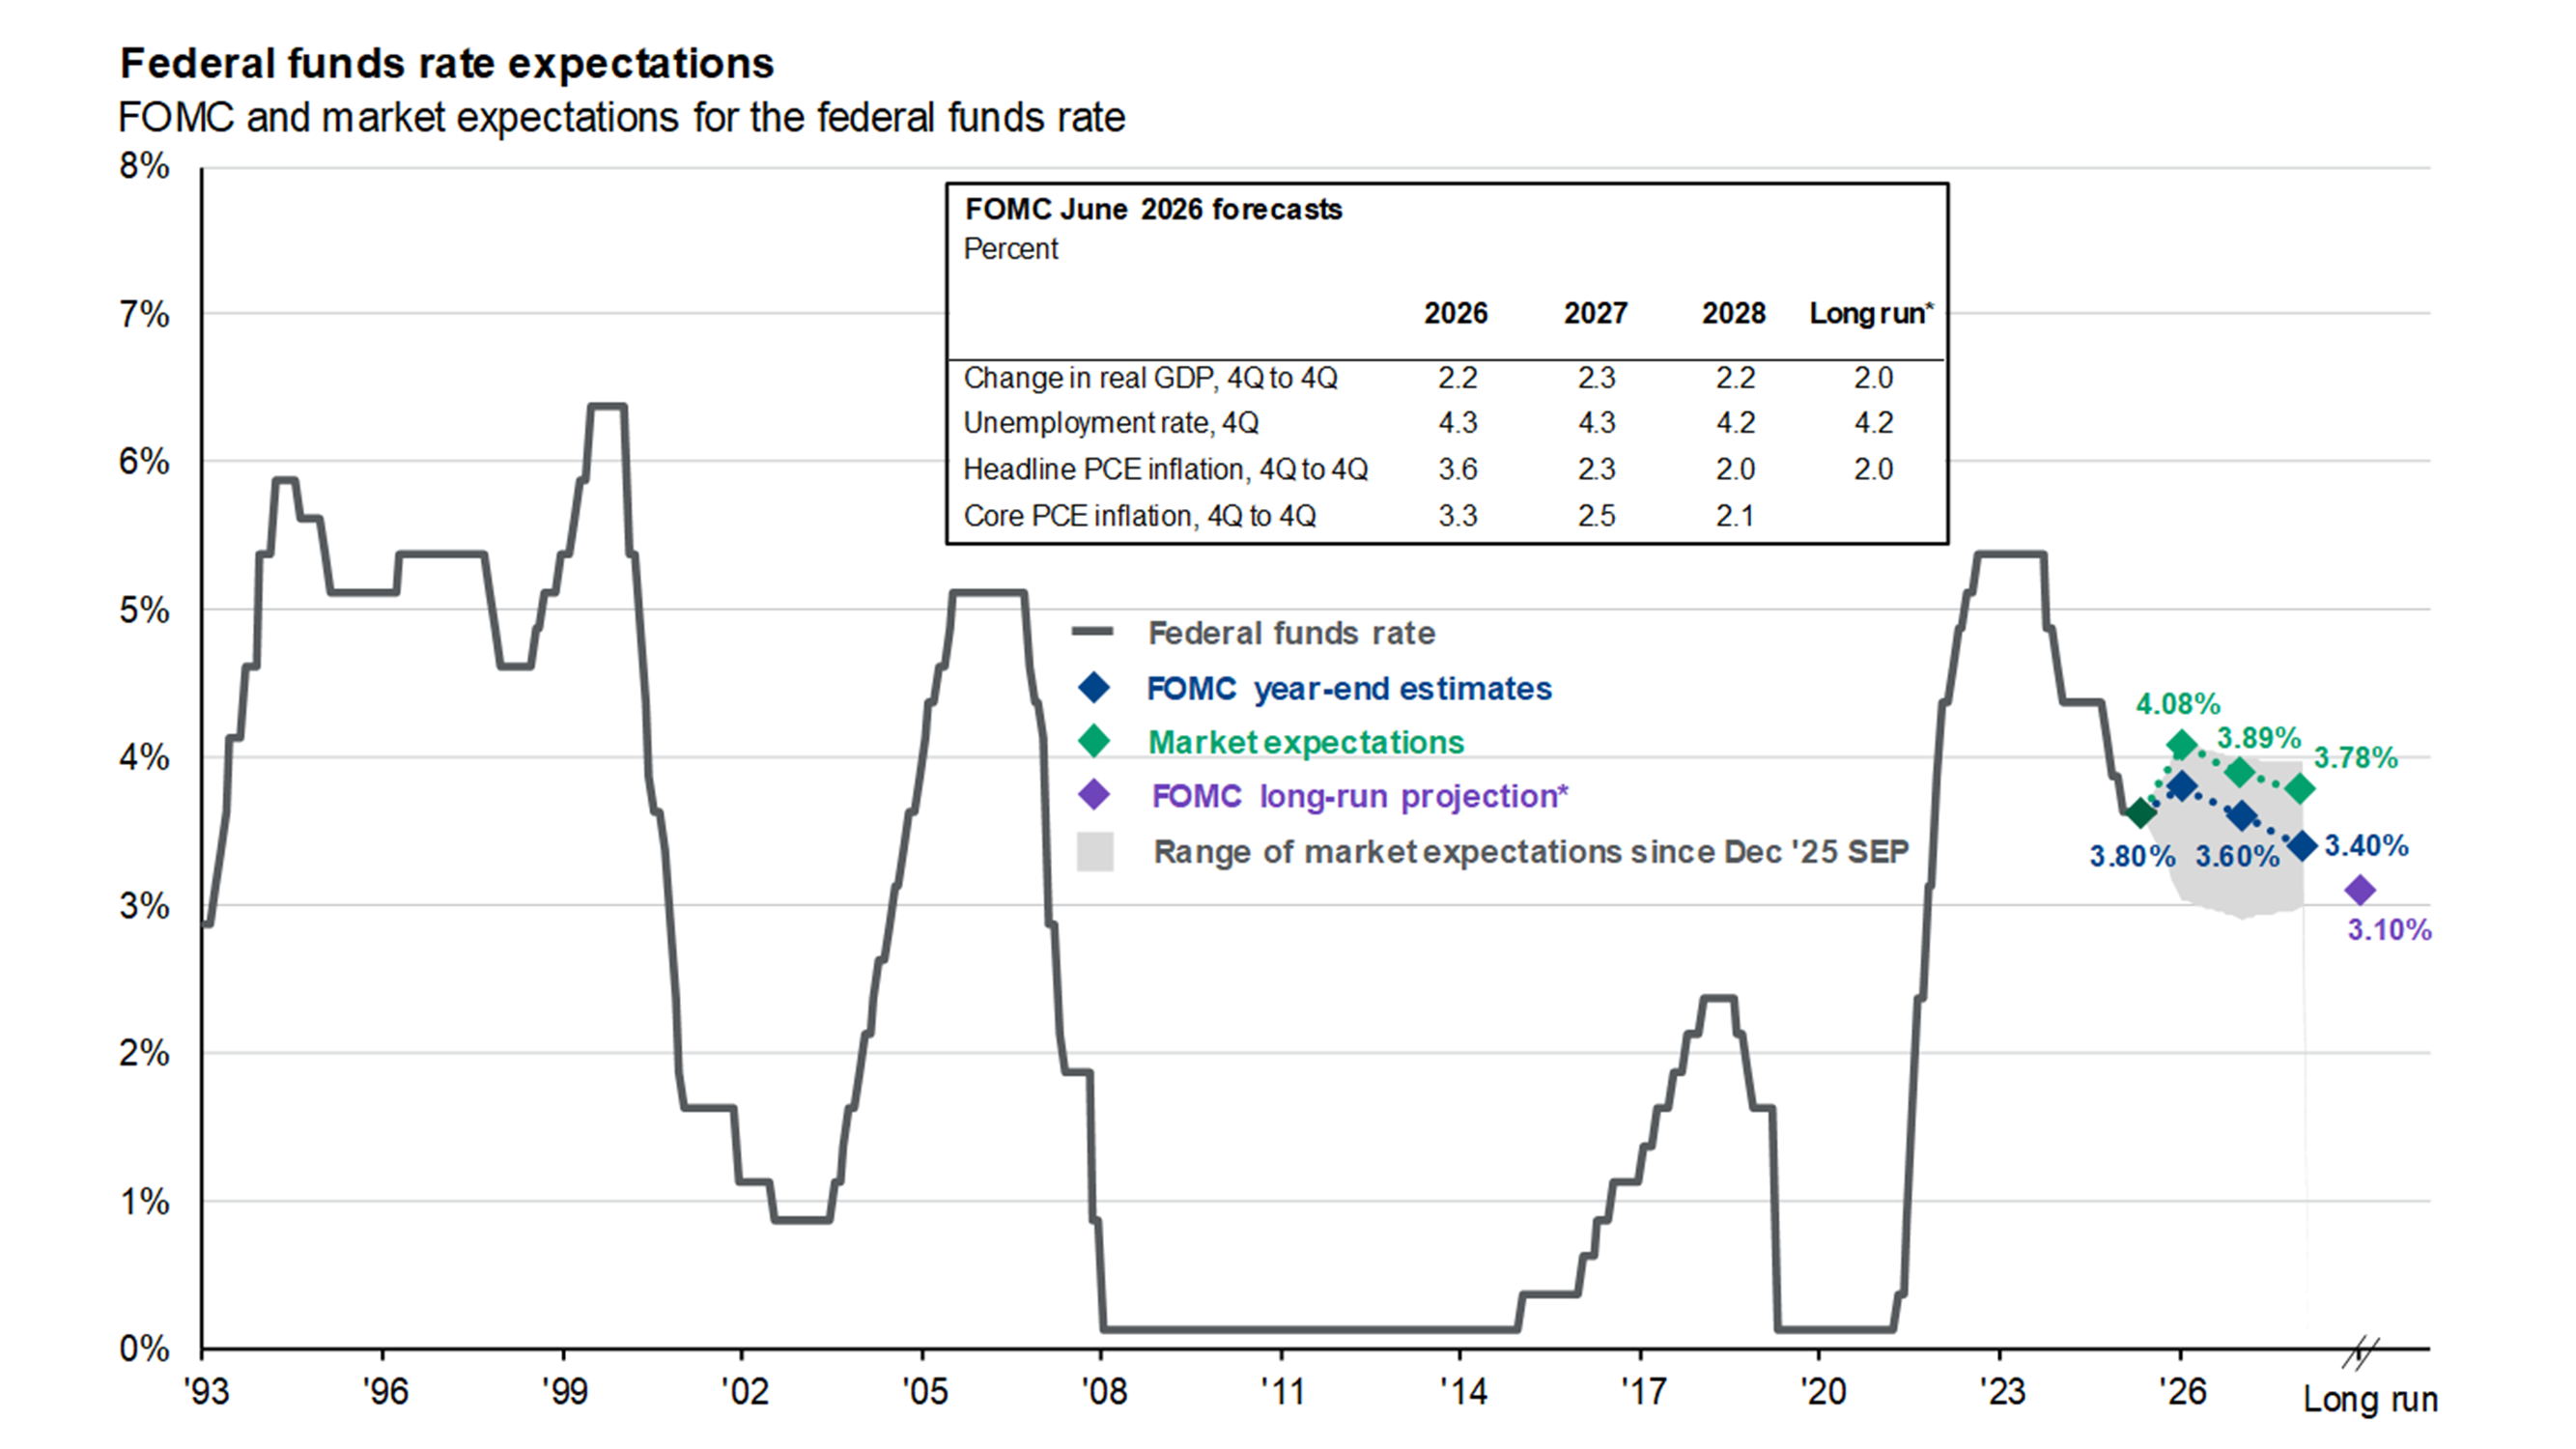
Market and FOMC expectations, illustrated above, are broadly aligned with this view. The FOMC dot plot points to a fed funds rate of approximately 3.80% at end-2026, drifting towards 3.40% by end-2028 and a long-run projection of 3.10%. Market pricing sits slightly above the FOMC dots, but is directionally the same. The path is downward. Warsh's short-term communication may be firmer than that path implies, but the fiscal reality behind him is not going anywhere.
The inflation–deflation tug-of-war
We continue to think that the ongoing tech advancements — which we have written about extensively over the past year — and the inevitable AI-driven efficiencies, place structural downward pressure on inflation over the longer term. AI is, in our view, a genuine deflationary force at the level of end-consumer prices, even though the buildout itself and the underlying infrastructure it requires (power, memory, cooling, industrial metals) are inflationary in the short term and in those specific sectors. From a macro perspective this tussle — inflation versus rates — remains the dominant near-term battle. We have written about it repeatedly, and it is not going away in Q3.
Iran, oil, and the market's attention span
In our Q1 letter we said we expected the Iran situation to fade as a market-moving event over the coming months. In truth we probably called an end to it a little quickly — the conflict itself has continued to drag on longer than we anticipated. But the market's engagement with it has faded almost exactly as we suggested: it has become much of a muchness. Even so, we remain mindful of the downstream impact of oil on inflation over the short to medium term, and we are watching it as one of the more plausible upside surprises for headline CPI over the next few prints.
4. Outlook: Calculated & Neutral
Our outlook for Q3, in short, is neutral. We believe the economy remains strong, but there are real short-term headwinds.
The historical Fed-chair pattern
Across nine decades of data, every new Fed chair has been greeted the same way: with an equity drawdown in his or her first three months in office. That is a pattern with unusually consistent history, and Warsh took over on 17 June. Extrapolating that pattern places the near-term risk of a market wobble squarely in Q3.
Midterm election year dynamics
The Fed transition is coinciding with the run-up to the US midterm elections — historically one of the most volatile periods in the American political and market calendar. Volatility in the run-up is well documented. What is less widely appreciated — and considerably more useful for long-term investors — is what happens after the midterm low is reached. Every single midterm year going back to 1934 has produced a rally off the midterm low averaging approximately 47%. Predicting or timing that low is a fool's errand, and we will not attempt it. But knowing the pattern exists changes how we respond to weakness when it arrives: opportunistically, not fearfully.
The contrarian signal from consumer sentiment
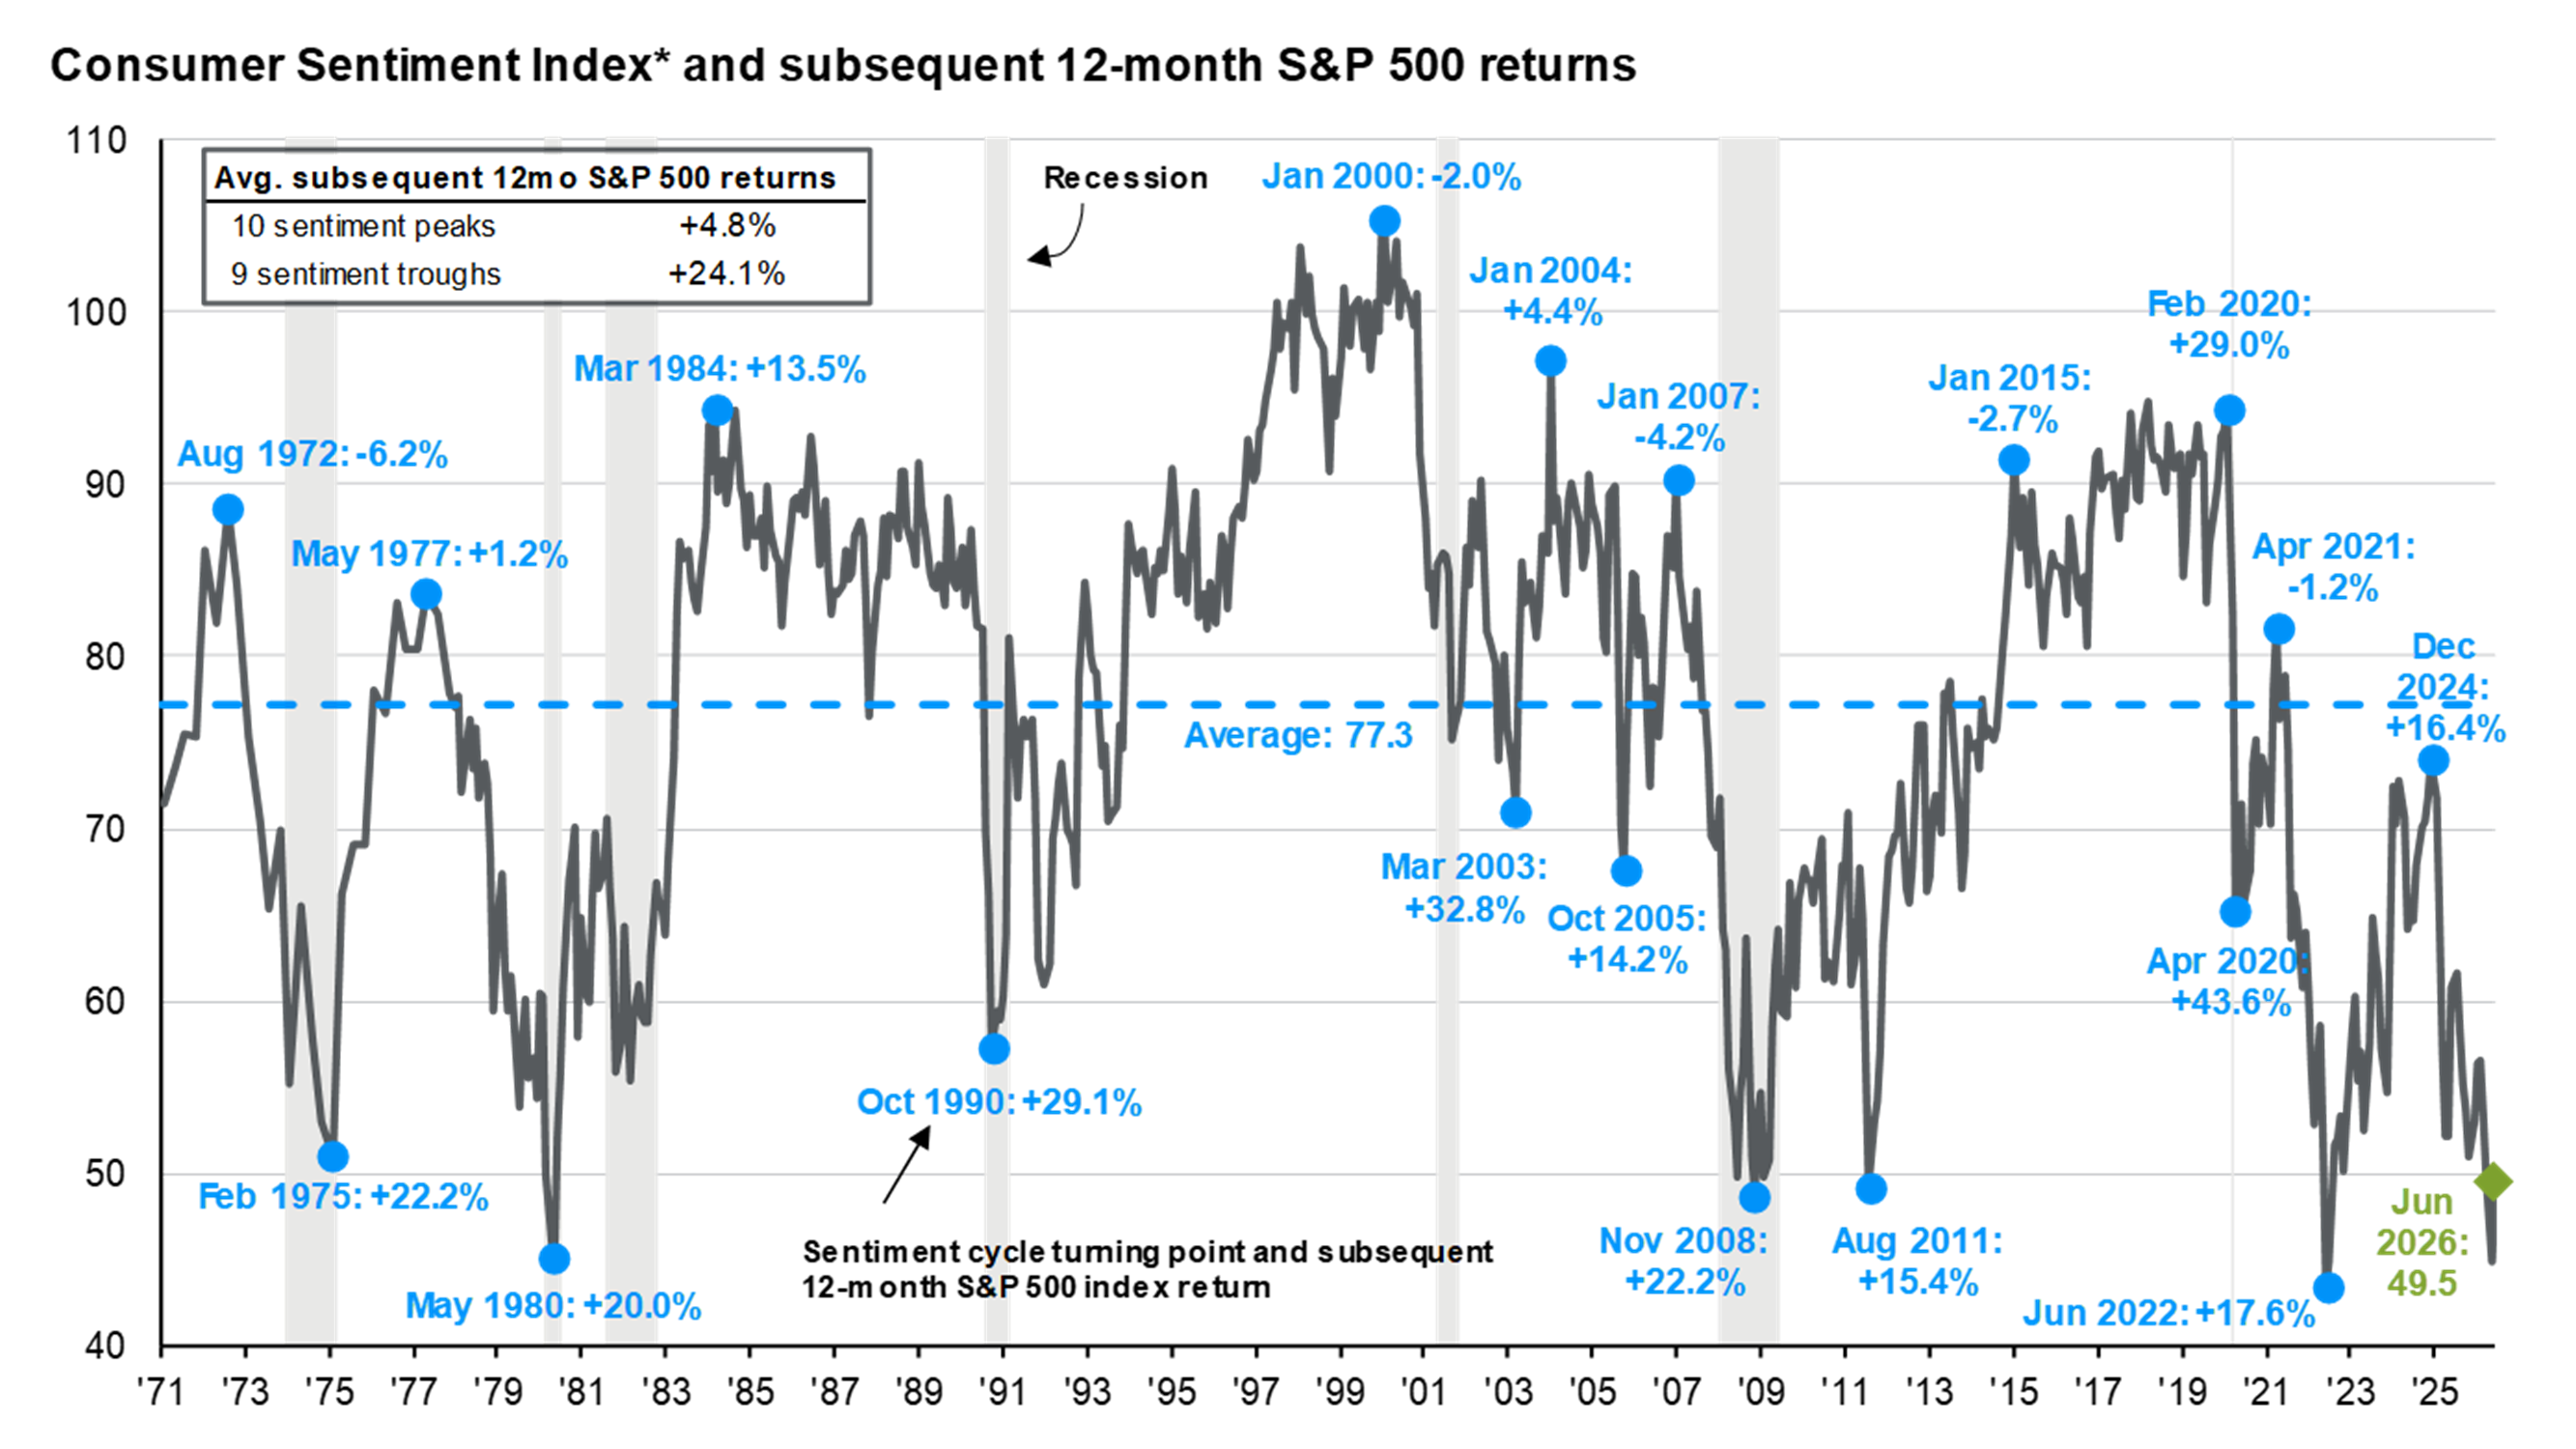
One chart we find valuable is the University of Michigan Consumer Sentiment Index. As of June 2026, the reading is 49.5 — well below the long-term average of 77.3, and close to some of the worst readings on record. In isolation, that sounds bearish. The historical pattern says otherwise. Forward 12-month S&P 500 returns following the nine prior sentiment troughs have averaged +24.1%, whereas returns following the ten prior sentiment peaks have averaged just +4.8%. Extreme low readings are, more often than not, a contrarian signal for equities.
A note on emotions and the long game
One of the hardest things to do as an investor is to buy when stocks are selling off. This is where real emotion enters the picture, and where investors most often do the wrong thing — panicking and selling when they should be adding. Buying into drawdowns realistically means the chance of a share going lower in the immediate term is very high; timing the exact bottom is next to impossible. The important qualification is that the discipline of buying into weakness only works when you are buying companies backed by solid fundamentals, sound strategy, competent management and durable competitive advantages. Executed properly, the probability of a lasting loss is even lower than the historical data suggests.
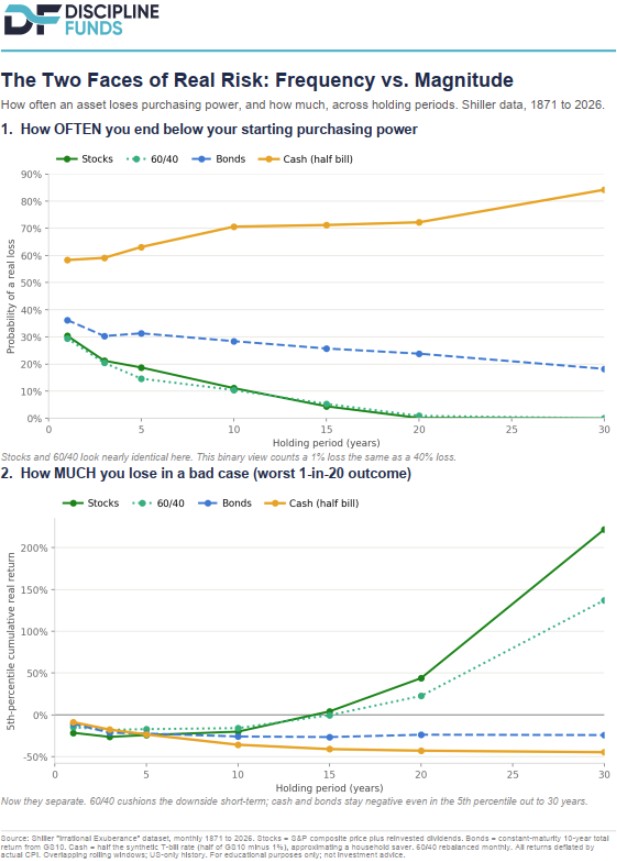
We will close with the chart that we think should be every long-term investor's default reference point in periods of stress: cash is safe over the short term and risky over the long term; equities are risky over the short term and safe(r) over the long term.
A note on the chart: the returns shown in the chart below are real returns, meaning they have been adjusted for inflation.
We remain deliberately positioned and clear-eyed about both the opportunities and the risks. The economy is in good shape. The AI buildout remains real and is not, in our view, a bubble. Corporate earnings are compounding. The Fed's medium to longer-term direction is downward. The environment beneath the surface — extreme dispersion, single-stock volatility at multi-year highs, sentiment at historic lows — continues to throw off individual opportunities on almost a weekly basis. Our job is to work through them with discipline, patience, and a clear-eyed view of what we own and why.

